enrollment
Leveraging Digital Marketing Campaign Data to Drive Continuous Improvement

You’ve established an advertising budget, identified program differentiators, collaborated on creative, and implemented an informed channel strategy. With your new digital marketing campaign in market, you’ll soon receive a steady stream of data that indicate how well your offering resonates with potential audiences. Now what will you do with it all?
In the right hands, this trove of campaign performance information offers a continuous feedback loop that allows you to learn and adapt. Take a deeper look to optimize targeting strategies, identify market trends, and improve operational effectiveness.
What to track
To harness these insights, you first need a data infrastructure that accurately captures and tracks the various elements of campaign performance, including impressions, click-through rates, click-to-lead conversion rates, cost-per-conversion, and spend metrics. Digital advertising accounts such as Google, Meta, LinkedIn, and others provide this information, each for their individual platform. But with their singular focus and varied features, formats, and structures, it’s most effective to utilize a single aggregator, such as RNL Envision, to unify the data.
How to leverage your data
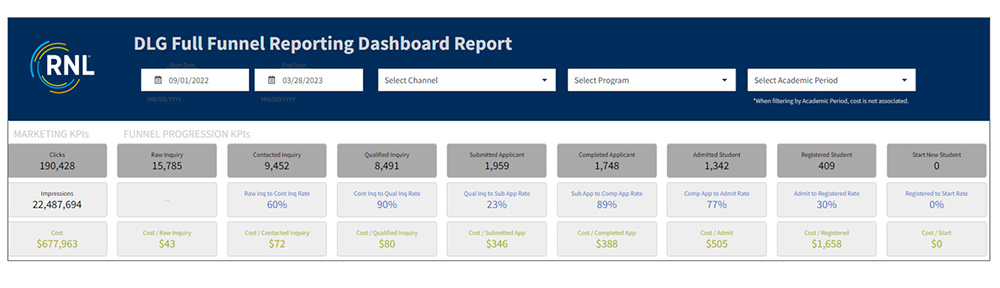
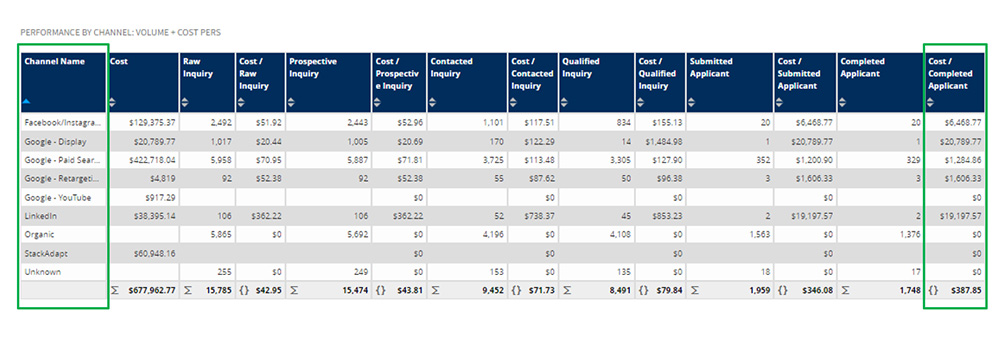
This consolidated top-of-funnel data shows which advertising strategies are driving the highest engagement and where you need to adjust tactics. But it doesn’t tell the whole story: You also need to know whether you are targeting the prospects most likely to enroll. That’s why it’s crucial to track the enrollment progression for each student through their entire enrollment journey. This requires a direct connection to your CRM through an API or other data integration, along with utm tagging to enable seamless exchange of interaction data with your enrollment database.
With full-funnel data, you’ll gain more impactful measures of campaign performance that allow you to track the lead source for every enrollment, assign prospects to specific campaign segments, and attribute conversions back to individual ads.
Talk with our digital and enrollment experts
We’re to help you find the right digital marketing and recruitment strategies. Let’s set up a time to talk.
Using the data to improve performance
Even the best-designed campaigns can be improved through ongoing analysis of the enrollment journey. Look for opportunities to recalibrate your marketing strategies by asking questions like these:
- Are click rates indicative of creative approaches that compel audiences to act?
- Does the ratio of advertising spend to lead volume indicate an effective mix of advertising channels, with an appropriate balance of lead generation, retargeting, and awareness tactics? (Remember that awareness advertising generates future leads.)
- Do top performing search keywords indicate that searchers intend to pursue a program that aligns with your offerings?
- Are prospective-to-contacted inquiry rates indicative of strong lead quality and timely speed-to-lead contact?
- Does the inquiry-to-application rate suggest that the offering meets prospects’ needs in terms of cost, convenience, and outcomes?
- Do application and yield rates demonstrate that you are targeting audiences with a high propensity to apply and enroll?
- Are application completion rates strong? Are you providing enough support to guide applicants through the process of collecting transcripts and completing other requirements?
- Do engagement trends throughout the funnel suggest that further research is needed to assess market demand for a particular offering?
This is a lot to consider, and if you’re among the 65 percent of the population who are visual learners, you might not quickly process long tables of aggregates and percentages. Fortunately, data visualization tools can help distill complex data into easily digestible formats to allow you to spot patterns, anomalies, and correlations and drive data-driven decision-making.
Beyond campaign improvements, with visualizations in hand you’ll be well positioned to share insights with academic leaders to influence new program development, curricular enhancements, modality shifts, and changes to program targeting.
So, dig in! Harness that campaign data to optimize your campaigns, grow enrollments, and solidify your institution’s position in an increasingly competitive market landscape. You can also reach out to our enrollment and marketing experts and we’ll set up a time to talk about how you can measure and optimize your digital marketing campaigns more effectively.
About the Author

As Senior Vice President, Vaughn is focused on providing strategic leadership to support revenue stability and growth at RNL’s college and university partners. Since joining the RNL team in 2013, Vaughn has partnered with more than...
Read more about Vaughn's experience and expertise
Reach Vaughn by e-mail at Vaughn.Shinkus@RuffaloNL.com.